
Go With The Flow - Part 1
/
Back in the mid-90s, Sun Microsystems, the creator of the Java programming language, coined the marketing slogan “The Network Is The Computer.” They were describing the Internet of twenty years ago, which obviously has grown into every corner of our lives today, as being as important if not more so than individual computers. The idea that individual nodes of a network can’t succeed on their own but only through communications and coordination sounds a lot like a pre-game pep talk in the locker room about teamwork and passing.
For continuous play sports like basketball and soccer, the optimal flow of the ball across a connected network of players is critical to winning. It was only a matter of time before network scientists, who were also sports fans, offered their advice on how these in-game connections can be measured and optimized.
In this two-part series, we’ll first take a look at research done at Arizona State University (ASU) on basketball, then, in the next article, an analysis of soccer networking and player metrics created by an engineering professor at Northwestern University. In fact, we'll see that "the network is the sport".
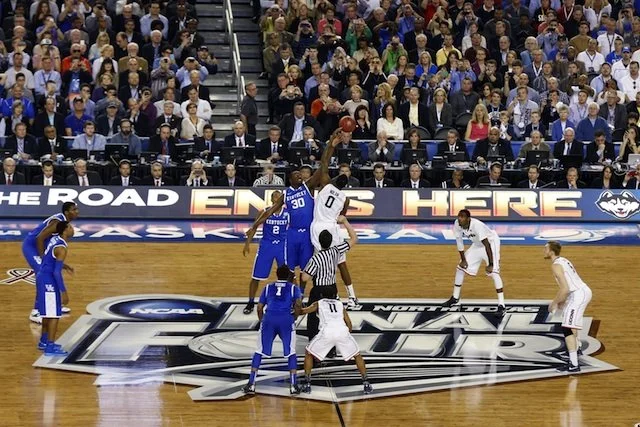
In traditional basketball offenses, transitions up the court begin with an inbound or outlet pass to the point guard who then becomes the hub of ball movement until his team eventually attempts a shot. But is that the most ideal strategy from a network flow standpoint? Even though a team’s point guard may be very skilled, would a less predictable ball movement be harder to defend?
In traditional basketball offenses, transitions up the court begin with an inbound or outlet pass to the point guard who then becomes the hub of ball movement until his team eventually attempts a shot. But is that the most ideal strategy from a network flow standpoint? Even though a team’s point guard may be very skilled, would a less predictable ball movement be harder to defend?
Jennifer Fewell, a professor in ASU’s School of Life Sciences in the College of Liberal Arts and Sciences and Dieter Armbruster, math professor at ASU, watched and diagrammed every offensive series from the first round of the 2010 NBA playoffs to build a network model for each team. Knowing the eventual outcome of the first round and the entire postseason, they were able to correlate network movement with wins and losses. ”We were able to come up with a hypothesis about strategy and then apply network analysis to that,” said Fewell.
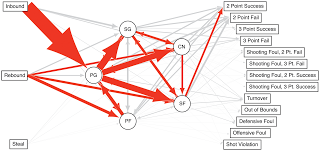 |
| Diagram 1 (click to zoom) |
 |
| Diagram 2 (click to zoom) |
“What that basically says is that the most successful teams are the ones that use a less predictable, more distributed offense and that connect their players more,” said Fewell. “Those were the teams that had actually hired more elite players and allowed them to work together.”
Their research was published in PLOS One.
Network models like these also help coaches evaluate players as part of a team in a way that pure stats such as points, assists and rebounds may not capture. This is especially true in soccer, where scoring is much more rare than basketball. In our next article, we’ll take a look at the work of Professor Luis Amaral of Northwestern University and a new soccer stat that he calls, “flow centrality.”