Imagine if the new Adidas soccer ball that will be used in this month’s
Euro 2012
tournament had a memory chip in it that could retrace its entire path
through each of the scheduled thirty-one games. Not only its direction
and distance traveled, but if it could also log each player’s touch
leading up to every shot on goal.
Would the sum of all of those
individual path segments tell the story of the game and which players
contributed the most to their team’s success? Northwestern University
engineering professor Luís A. Nunes Amaral has not only answered that
question, but has now built a side business to enlighten coaches and
fans.
While most sports have an abundance of statistical metrics to measure
a player’s development, soccer’s fluid gameplay and low scores make it
more difficult to evaluate a specific player’s impact and contribution.
To fill the void, several game analysis service firms now offer data on
each action of every player during a game, but it’s left to the
consumers of this data (coaches, players and fans) to interpret what
combination of stats best explains if the team is improving beyond the
ultimate metric of wins and losses.
Amaral, a lifelong player and fan from Portugal, saw an opportunity to help. “In soccer there are relatively few big things that can be counted,”
he said. “You can count how many goals someone scores, but if a player
scores two goals in a match, that’s amazing. You can really only divide
two or three goals or two or three assists among, potentially, eleven
players. Most of the players will have nothing to quantify their
performance at the end of the match.”
In his
lab at Northwestern,
Amaral and his team of researchers study complex systems and networks;
everything from metabolic ecosystems, the Internet, neural networks in
our brain and the propagation of HIV infection. To him, the game of
soccer is no different.
“You can define a network in which the elements of the network are
your players,” he commented. “Then you have connections between the
players if they make passes from one to another. Also, because their
goal is to score, you can include another element in this network, which
is the goal.”
They dug into the stats of the previous European championship, Euro
2008, and mapped the ball movement and player statistics for each game
into a computer model. They made the assumption that the basic strategy
of every soccer team is to move the ball towards their opponent’s goal.
“We looked at the way in which the ball can travel and finish on a
shot,” said Amaral, who also is a member of the Northwestern Institute
on Complex Systems (NICO) and an Early Career Scientist with the Howard
Hughes Medical Institute. ”The more ways a team has for a ball to
travel and finish on a shot, the better that team is. And, the more
times the ball goes through a given player to finish in a shot, the
better that player performed.”
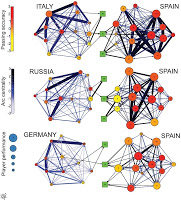
By combining a player’s passing efficiency (number of successful
passes divided by total passes) and the ball flow around the field, the
model can draw a network diagram of the paths that most often led to a
shot on goal. These well-worn paths begin to tell a story of which
players are the most reliable and effective. Amaral has given a very
sports-bar worthy name to this ability – flow centrality. The more
often that a player is involved in the build-up of passes towards a
shot, the more vital he or she is to the team’s success.
The research was published in the online science journal,
PLoS ONE.
Since the study came out almost two years ago, Amaral has set-up a new company,
Chimu Solutions,
to not only offer soccer analysis but also to expand their algorithms
and software to other lines of business to reveal “intricate team
dynamics as well as individual metrics with the goal of differentiating
role players from superstars.”
While goal scorers and goalkeepers most often get their names in the
headlines, it’s often the supporting cast of players that determine the
outcome of games. Understanding how the ball should be and how it is
moving up and down the field is critical to player development and game
tactics. One of the most difficult skills for free-flowing sports like
hockey and soccer is the visual awareness of teammates’ locations and
quick decisions to make progress towards the goal. Flow centrality may
just be the answer.
Visit Axon Sports on Twitter and Facebook