
Learning From Ghosts - How AI And Machine Learning Are Changing Sports
/It was an odd but effective analogy that the Manchester United players heard that day from their manager. “I remember going to see Andrea Bocelli, the opera singer. I had never been to a classical concert in my life. But I am watching this and thinking about the coordination and the teamwork, one starts and one stops, just fantastic. So I spoke to my players about the orchestra - how they are a perfect team.”
Sir Alex Ferguson, who won 38 trophies during his 26 years in charge at Old Trafford, recalled that particular pre-game talk to Anita Elberse, a professor at Harvard Business School, as part of a case study she created about his demanding but successful management style, albeit of a sports team rather than a company.
The symphony metaphor is appropriate for most team-based, invasion-type sports as only the unified efforts of all players creates the desired result, whether it be harmonious music or consistent victories. "To me, teamwork is the beauty of our sport, where you have five acting as one,” said Mike Krzyzewski, all-time wins leader in college basketball, who sounds much like Phil Jackson, owner of 11 NBA Championship rings, "the strength of the team is each individual member. The strength of each member is the team."
During a game, one player’s movement influences not only his teammates’ proactive adjustments but also the reaction of his opponents. A ball carrier’s cut to the left instead of the right changes the dynamics of both teams. At the end of the game, it’s interesting to know each individual’s analytics, like distance covered, passes completed and shooting percentage, but it is vital to visualize the coordinated movement of the team to truly understand how games are won and lost. The outside defender, small forward or right winger may have had a particularly good or bad day, but their net effect on the ensemble is what matters.
For decades, coaches have relied on game film to recall and explain what happened. Watching the action on video gives a richer, realistic recap of the motion that static statistics can’t provide. More recently, combining film with a numerical analysis offered two important but distinct assessments that still requires coaches to integrate. Today’s attempts to bring together the analog fidelity of film with the digital accuracy of analytics has stalled. Annotating video clips with play data, which allows for easier searches and context specific stats, helps but provides no way to apply advanced tools, like artificial intelligence (AI) and machine learning, to the thousands of micro movements and positional changes of players throughout a game.
Cue the Engineers
In 2010, when Peter Carr and Patrick Lucey arrived at Disney Research, armed with doctoral degrees in computer vision and speech recognition, respectively, they planned to contribute to the technical broadcast end of both Disney and its subsidiary, ESPN.
“Patrick and I were interested in understanding the sports broadcasting process, i.e. what do the camera operators choose to look at, and what storylines do the commentators discuss?,” Carr recalled in a recent interview. “We quickly realized that any insights into this process required a thorough understanding of what was going on in the current match, and that existing statistical methods seemed inadequate for this task.”
That inadequacy ignited a seven year research agenda to move the sports analytics world to its next logical progression, measuring and analyzing team movement. The emergence of player tracking systems, like SportVU from STATS, provided the raw “GPS” data to digitize motion. Introduced in NBA arenas in 2010, the SportVU multi-camera system tracks and delivers real-time X, Y coordinates of each player and X, Y, Z coordinates of the ball at a rate of 25 times per second. Now available for multiple sports, this goldmine of movement data is the fuel that analysts and programmers needed to digitize player logistics.
“We like to think about sports data as a method of reconstructing the story of a match,” said Lucey. “With tracking data we can reconstruct the story in finer detail, and allows us to answer specific questions.”
Lucey, who recently transitioned from Disney to lead STATS’ data science team, relishes the opportunity to dive into the sheer volume of data available. “While I had five great years at Disney Research, I always wanted to be able to work with teams and work with data from the source,” said Lucey. “At STATS, we have been around for over 35 years and have amassed the world's largest treasure trove of data. People probably don't know it, but when you search for a score on the internet or social media - there is a good chance that information comes from us at STATS. In terms of tracking data, we also have the most amount of tracking data in basketball (over 5,000 games) and soccer (over 12,000 games).”
In sports like basketball and soccer, coaches repeatedly emphasize the search for space and time. Pick and roll or swing offenses strive to open up space momentarily for a shot in basketball. Switching the field with long passes to the opposite side gives soccer players time to move forward before defenders close down the space. So, using the spatiotemporal data provided by player tracking allows coaches to measure the success of their tactics.
“For me, the common thread has been developing machine learning algorithms to better understand spatiotemporal data about human behavior,” said Carr when asked about the purpose of their research. “Team sports is a fascinating example because you have several teammates cooperating in an adversarial setting against another team. There is lots of tracking data at the professional level which makes it possible to use advanced techniques like ‘deep imitation learning.’”
Deep imitation learning sounds like one of those murky, out of control AI nightmare scenarios that Elon Musk keeps warning us about. But in Lucey and Carr’s world, it involves teaching a computer simulation how coordinated motion of the best teams achieve the best statistical efficiency, known in the analytics world as “expected wins”, or “expected goals”.
“In many complex situations, it can be very challenging for a human expert to describe and codify the policy or strategy due to the granularity or fidelity of the situation,” wrote Lucey and Carr, along with fellow CalTech researchers Hoang Le and Yisong Yue, in a paper describing the project presented at the 2017 MIT Sloan Sports Analytics Conference (SSAC). “For such tasks, we can use machine learning to automatically learn a good policy from observed expert behavior, also known as imitation learning or learning from demonstrations, which has proven tremendously useful in control and robotics applications.”
While these expected value measures compare a player’s performance to a league average, (i.e. the expected point value for a certain player in a certain game scenario), coaches and athletes would often prefer to know how the movement of all the players created the time and space opportunity for that shot. Through brute force, using seasons worth of data, these algorithms learn the subtle positioning of players that produces the best result, not through a real human intelligence of the game but a truly artificial yet effective intelligence.
“One crucial insight from our research is that a computer must have a framework for anticipation,” said Carr. “When machine learning algorithms only react to the current situation (without considering cascading effects), the results are clearly below what humans can do. However, we have been able to predict how specific teams will defend in different situations.”
The Disney team was inspired by the work of the Toronto Raptors analytics staff who spent five years painstakingly loading and programming SportVU data to be able to not only show what Raptors’ players did in a past game, but also to predict what they should have done to more effectively counter an attack. Imagine a coach’s whiteboard with a diagram of the court. Now add different colored dots, one for each player on each team, red for the Raptors and blue for their opponents. Using just the historical SportVU positional X-Y data, the dots can be put into motion in a time lapse sequence showing a particular play. This would be no different than watching the actual game film, just substituting dots on a screen for the actual players.
But then the magic happens. From a defensive perspective, coaches know the actual result of the play from film but they may ask “what should we have done?” And since excellence breeds imitation, they may also be curious what the best defensive team in the league would do in that situation. What if we could add a third set of players or dots to the screen that simulate the best movement pattern to defend that play. Each real player could compare their actual movement with the ideal movement as the play unfolds. These “ghost” players would represent an optimized defensive team that could then be mimicked in practice drills.
And that’s exactly what the Raptors staff did. As Zach Lowe described in a Grantland article, “In simple terms: the Raptors’ analytics team wrote insanely complex code that turned all those X-Y coordinates from every second of every recorded game into playable video files.”
And that third set of dots shown on the sample video the Raptors provided?
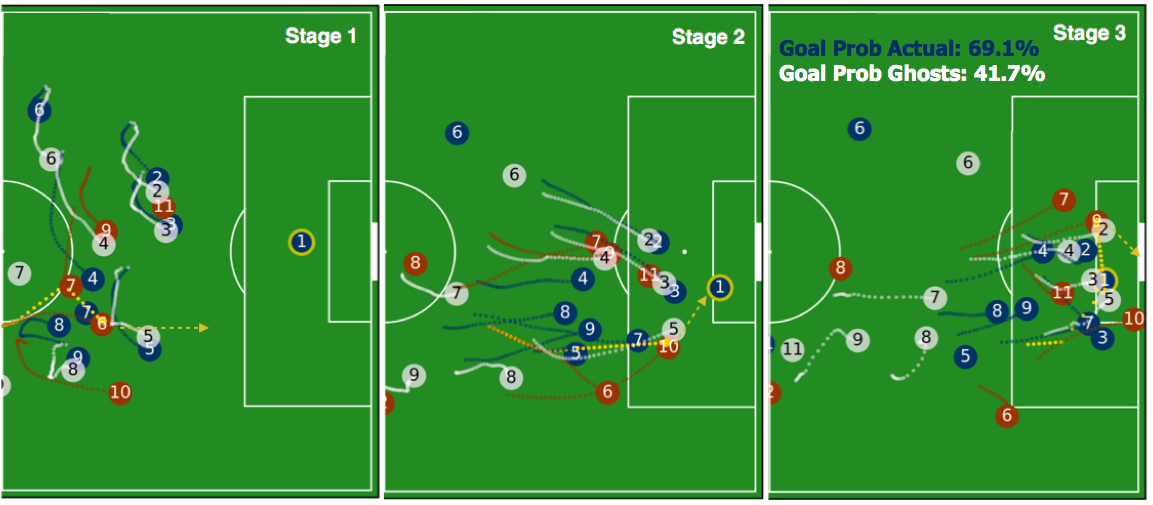
© Disney Research
“Those are ghost players, and they are doing what Toronto’s coaching staff and analytics team believe the players should have done on this play — and on every other Toronto play the cameras have recorded. The system has factored in Toronto’s actual scheme and the expected point value of every possession as play evolves. The team could use that expected value system to build an “ideal” NBA defense irrespective of the Toronto scheme.”
Unfortunately, the tedious, manual data entry and annotation was very time-consuming. So, the Disney team set out to help automate the process with a data-driven approach using a season’s worth of tracking data. By feeding millions of data points into learning algorithms, the logic of the next movement is uncovered much like AI systems that have been taught how to play a game of Go or chess.
Thanks to their access to 100 games of English Premier League player tracking data, they focused on “ghosting” an EPL team’s defense, using about 17,400 sequences of attacking-defending game clips. Just as the Raptors’ staff had done manually, Lucey and Carr’s team was able to model what a “league average” team of defenders would do as compared to the actual reactions of a single team. Better yet, they could also isolate and ghost how the best defensive team in the league would react to the same attacking play. For both the actual defenders in that game and the league average ghosts, their expected goal value (EGV), the probability that a goal would be scored, was a disappointing 70%. But when the ghosts of the league’s best defenders were dropped into the same scenario, the EGV dropped to about 40% thanks to more proactive defending decisions.
Plenty of Possibilities
As the volume of player tracking data grows, so does the what-if possibilities. Other recent insights from the Disney team has been that soccer teams tend to position themselves higher up the field in more aggressive formations while away teams take a more conservative, defensive approach. Whether that bias is intentional or not is for the coaches to discuss but Lucey and Carr have an idea.
“Utilizing an entire season’s data from Prozone from a top-tier professional league, we used our automatic approach to see whether the formation they played had anything to do with explaining why teams are more successful at home rather than away,” said Lucey and Carr. “Our analysis showed that nearly all teams tend to play the same formation at home as they do away, however, the way they executed the formation was significantly different. Specifically, we were able to show that at home, teams played significantly higher up the field compared to when they played away (or conversely, teams sat much deeper at away games). This conservative approach at away games suggests that coaches aim to win their home games and draw their away games.”
And while expected goal statistics tell us the probability of a scoring chance, coaches would still like to know the contributing factors leading to those opportunities. Again, the tracking data revealed the influences on a season’s worth of shots taken in the EPL.
“From the data, we analyzed the spatiotemporal patterns of the ten-second window of play before a shot for nearly 10,000 shots,” said Lucey and Carr. “From our analysis, we found that not only is the game phase important (i.e., corner, free-kick, open-play, counter attack etc.), the strategic features such as defender proximity, interaction of surrounding players, speed of play, coupled with the shot location play an impact on determining the likelihood of a team scoring a goal.”
And when they looked at over 20,000 three-point baskets from the 2012-13 NBA season, more clues emerged on how teams get their shooters open, which, unsurprisingly, raised their percentage. One interesting movement feature was the number of times a defensive team swapped their roles when switching who they guarded.
“We compared many different offensive and defensive team factors, such as team area, distance ran, velocity, acceleration, dribbles, possessions and passes - as well as our new role-swaps measure,” said Lucey and Carr. “We showed that only the defensive team factors such as team distance, velocity, acceleration and role-swaps were predictive of the offensive team getting an open shot (in addition to dribbles and possessions), and showed that the type of role-swaps that occur are also informative of how a team gets an open shot (e.g. point-guard switching with the small-forward).”
Explaining all of this wizardry to coaches may get plenty of blank stares, not because they don’t understand the logic but that they’re uncomfortable with a computer making decisions and instructing players on proper team movement. Lucey and Carr have seen those indifferent reactions before and have learned that their technology must be sold as a tool that coaches have available rather than competition to their years of “seeing it with their own eyes.”
“We have to be careful of what tracking data can give us and more importantly what it can't,” said Lucey. “There are limits of tracking data as it is just the center of mass (i.e., dots moving around). Instead of automating analysis, we think the sweet-spot is to build technology which helps a domain expert to their job better - create assistive tools for domain experts. Examples could be retrieving plays in video quickly, or highlighting key patterns of play of a team/player.”
“The coaches/analysts have a great intuition on what is occurring. Technology should be able to help them quickly check these aspects. The important thing is not to tell people their jobs - they know it really well and is why they are in those positions. But we can help them do their job more efficiently. That is the big goal of my data-science group - creating technology to do this.”
While SportVU cameras are still expensive enough to limit their use to top pro and college teams, wearable trackers might be a possibility for the mass market of teams at the high school and club level.
“Radio frequency identification trackers (RFID) generate similar, but also very different data,” explained Carr. “Because they are on the body of athletes, there is the potential to measure other information like heart rate. But, unlike camera based systems, RFID only returns the location of the tracker (and any auxiliary data that can be sensed locally by the device). You don’t get the same fidelity of information that is available in a video stream, like seeing the body pose of a player (or at least which direction they are facing).”
Still, Lucey thinks the ubiquity of personal fitness trackers is a market that can’t be ignored.
“Non-pro athletes that have wearables on their body, like Fitbit, that capture the location and physiological data are becoming commonplace. Something that we are very excited about at STATS is the ability to capture tracking data from any type of device and process it to do analysis.”
Even game video shot from a basic digital camera may soon be used to extract data on movement and even body kinematics.
“Computer vision has improved so much, where this is actually a feasible thing now. We had a paper at the recent SSAC conference, from our very talented intern, Panna Felsen from UC Berkeley, that looked at how we can potentially use the body-pose estimated directly from a broadcast view, to conduct shot analysis. We did it on NBA players, but you can imagine that this could scale eventually to non-pro scenarios.”
The Power of Observation
One of the outcomes from the Harvard case study on Manchester United’s Ferguson was a list of his management methods, what Elberse dubbed, “Ferguson’s Formula.” In it, he recalled when he was a young manager at one of his first clubs, Aberdeen in Scotland. His assistant manager asked for a larger role in the team’s practice sessions, as Ferguson was running everything on the field. At first, Ferguson fought the loss of control but then was convinced that stepping back and observing the team from new angles opened up new insights into their play.
“As a coach on the field, you don’t see everything,” said Ferguson. “I don’t think many people fully understand the value of observing. I came to see observation as a critical part of my management skills. The ability to see things is key—or, more specifically, the ability to see things you don’t expect to see.”
That’s exactly what Lucey and Carr are trying to provide to teams, coaches and fans, an opportunity to see things you don’t expect to see.
Daniel Peterson is a writer and consultant specializing at the intersection of neuroscience and athlete performance. His latest book, The Playmaker’s Advantage, arrives in 2018 from Jeter Publishing/Simon & Schuster. Follow him on Twitter @DanielPeterson.
© 2018 Daniel R. Peterson